Debugging failed runs
Data engineers spend more time debugging failures than writing new pipelines, so it’s important to know how to debug a failing dbt execution step.
To demonstrate, we’re going to intentionally make a bug in our dbt model code, see it fail in Dagster, troubleshoot the failure, and then re-run the pipeline. Here, you’ll learn how to debug your dbt assets similarly to how you would troubleshoot dbt on its own.
Open the
stg_zones.sqlfile and add a new column calledzone_populationto theselectstatement. Your code should look like the following:with raw_zones as ( select * from {{ source('raw_taxis', 'zones') }} ) select zone_id, zone as zone_name, borough, zone_name like '%Airport' as is_airport, zone_population -- new column from raw_zonesNavigate to the Dagster UI and reload the code location by either clicking the Reload Definitions button or using Option+Shift+R.
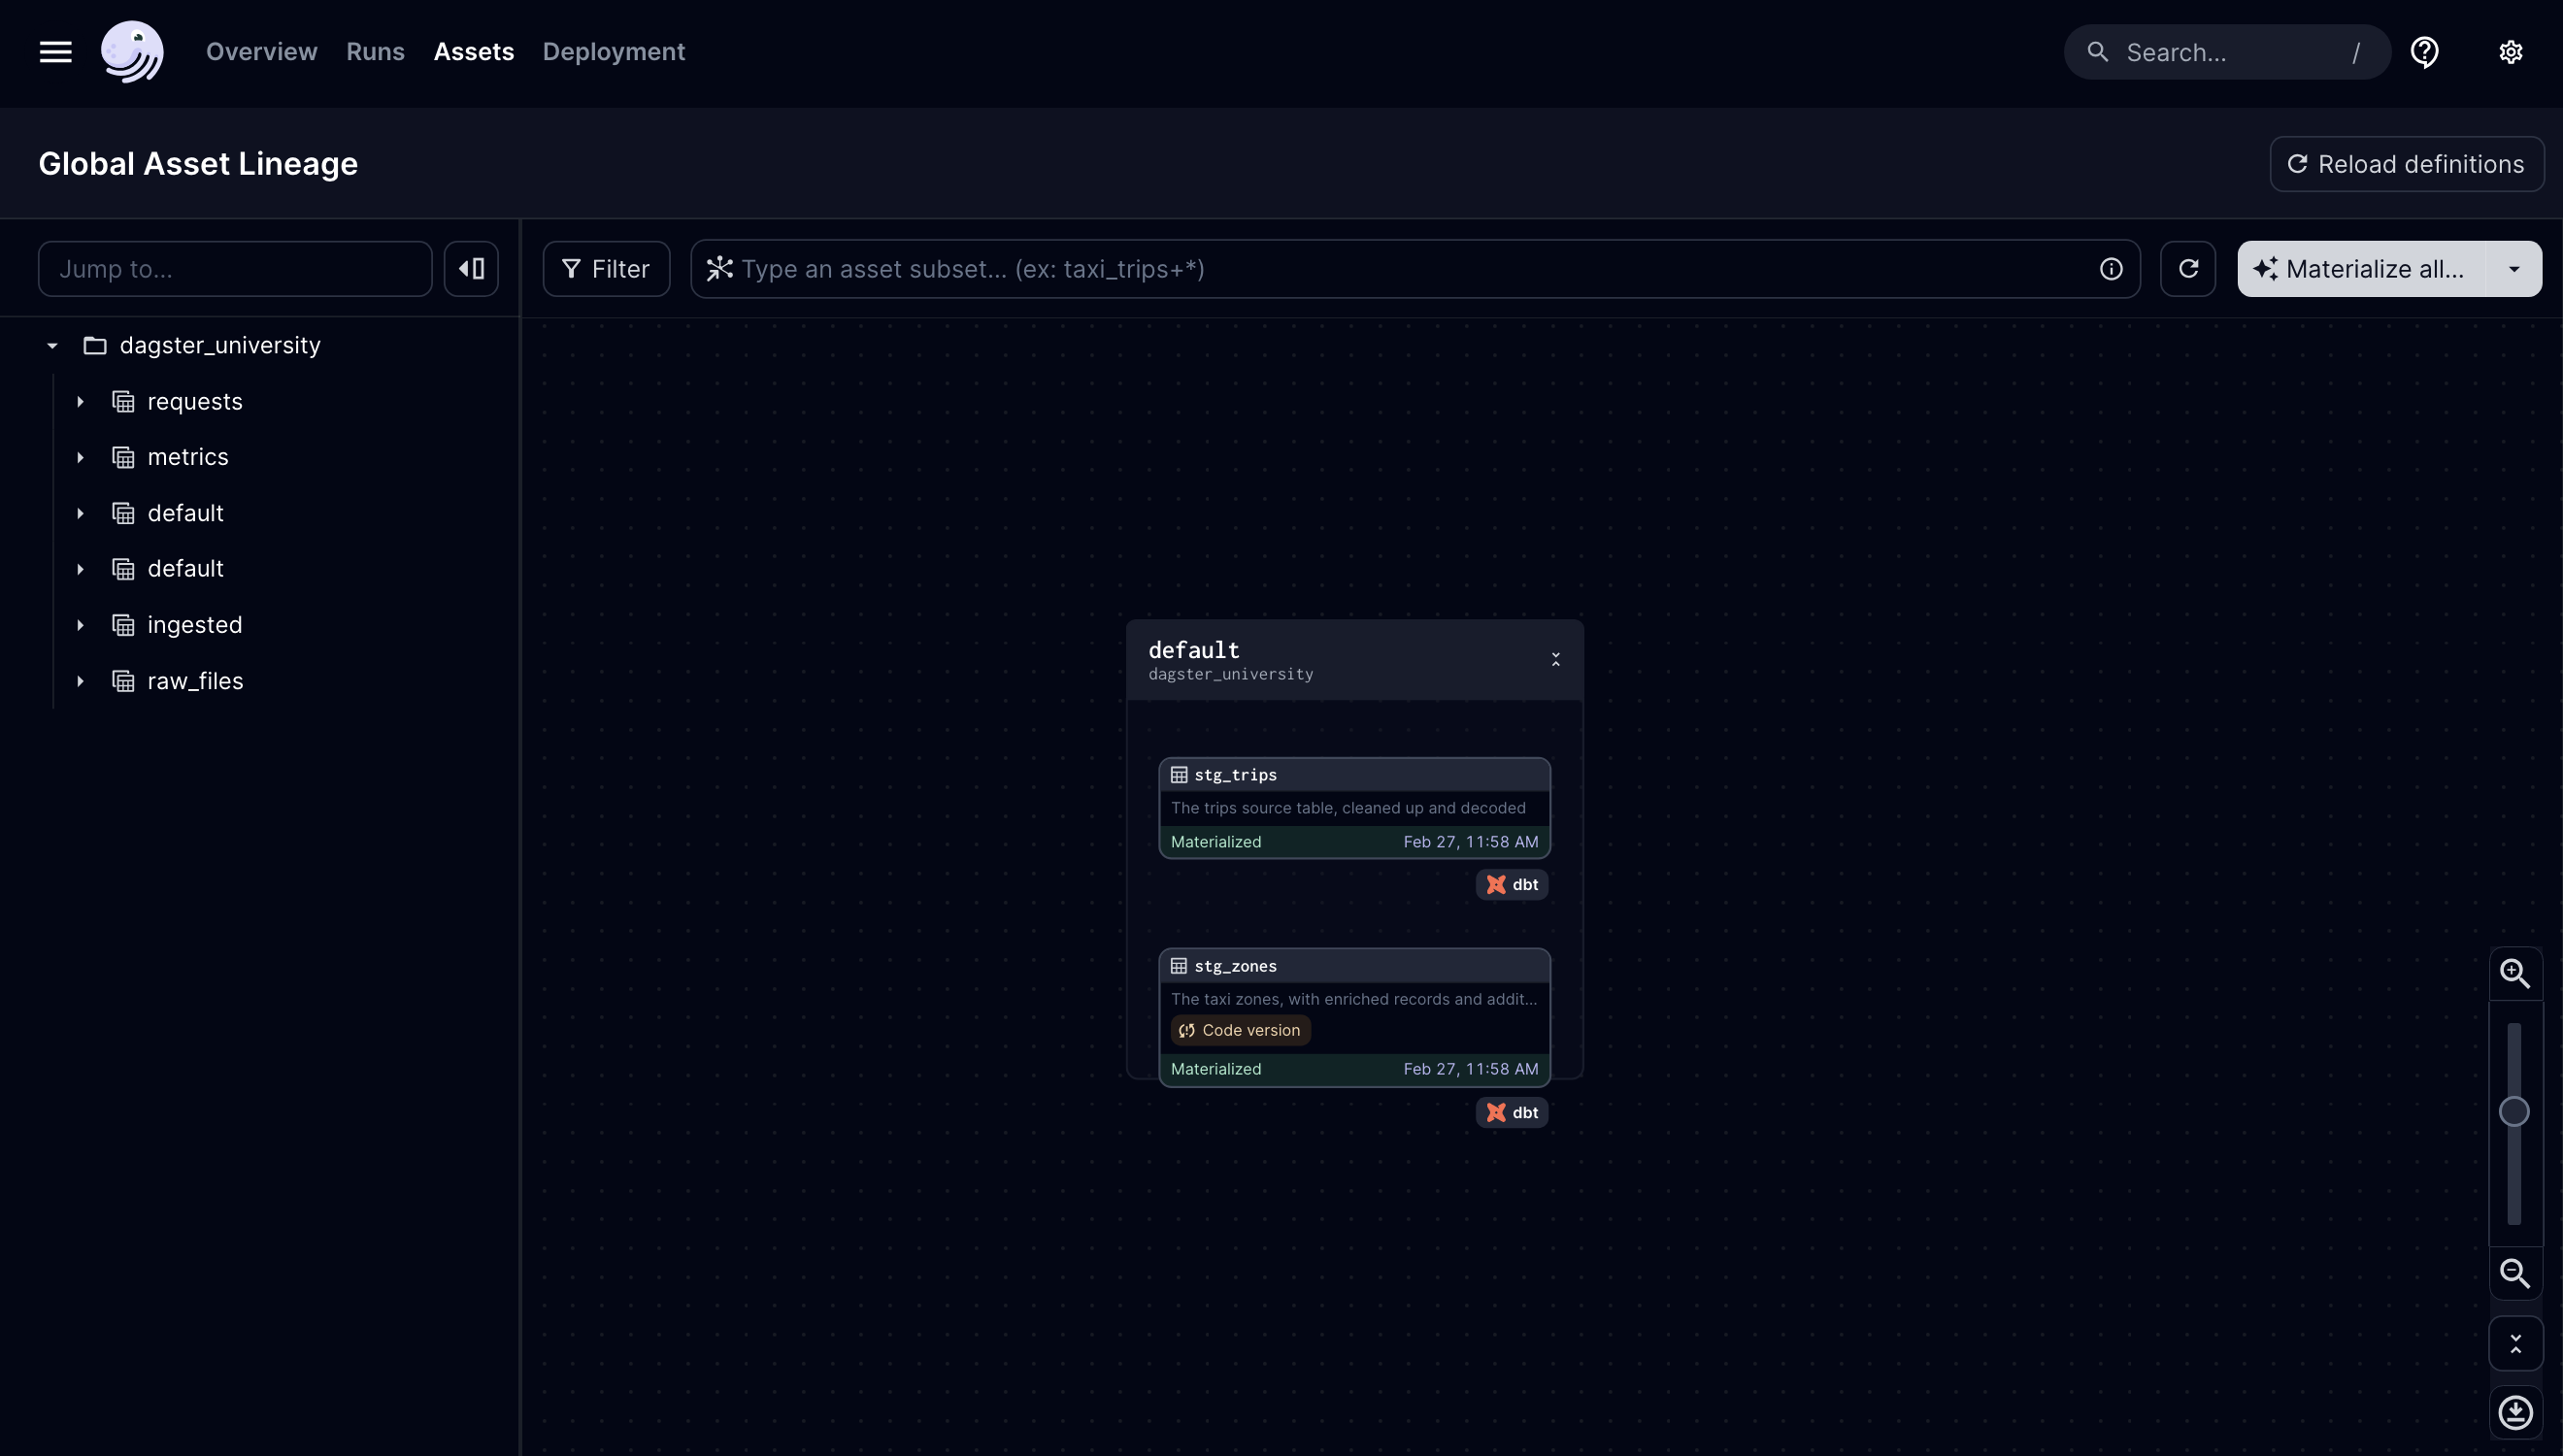
On the asset graph, locate the
stg_zonesasset. You’ll see a yellow Code version tag indicating that Dagster recognized the SQL code changed:
Select the
stg_zonesasset and click the Materialize button.Navigate to the run’s details page.
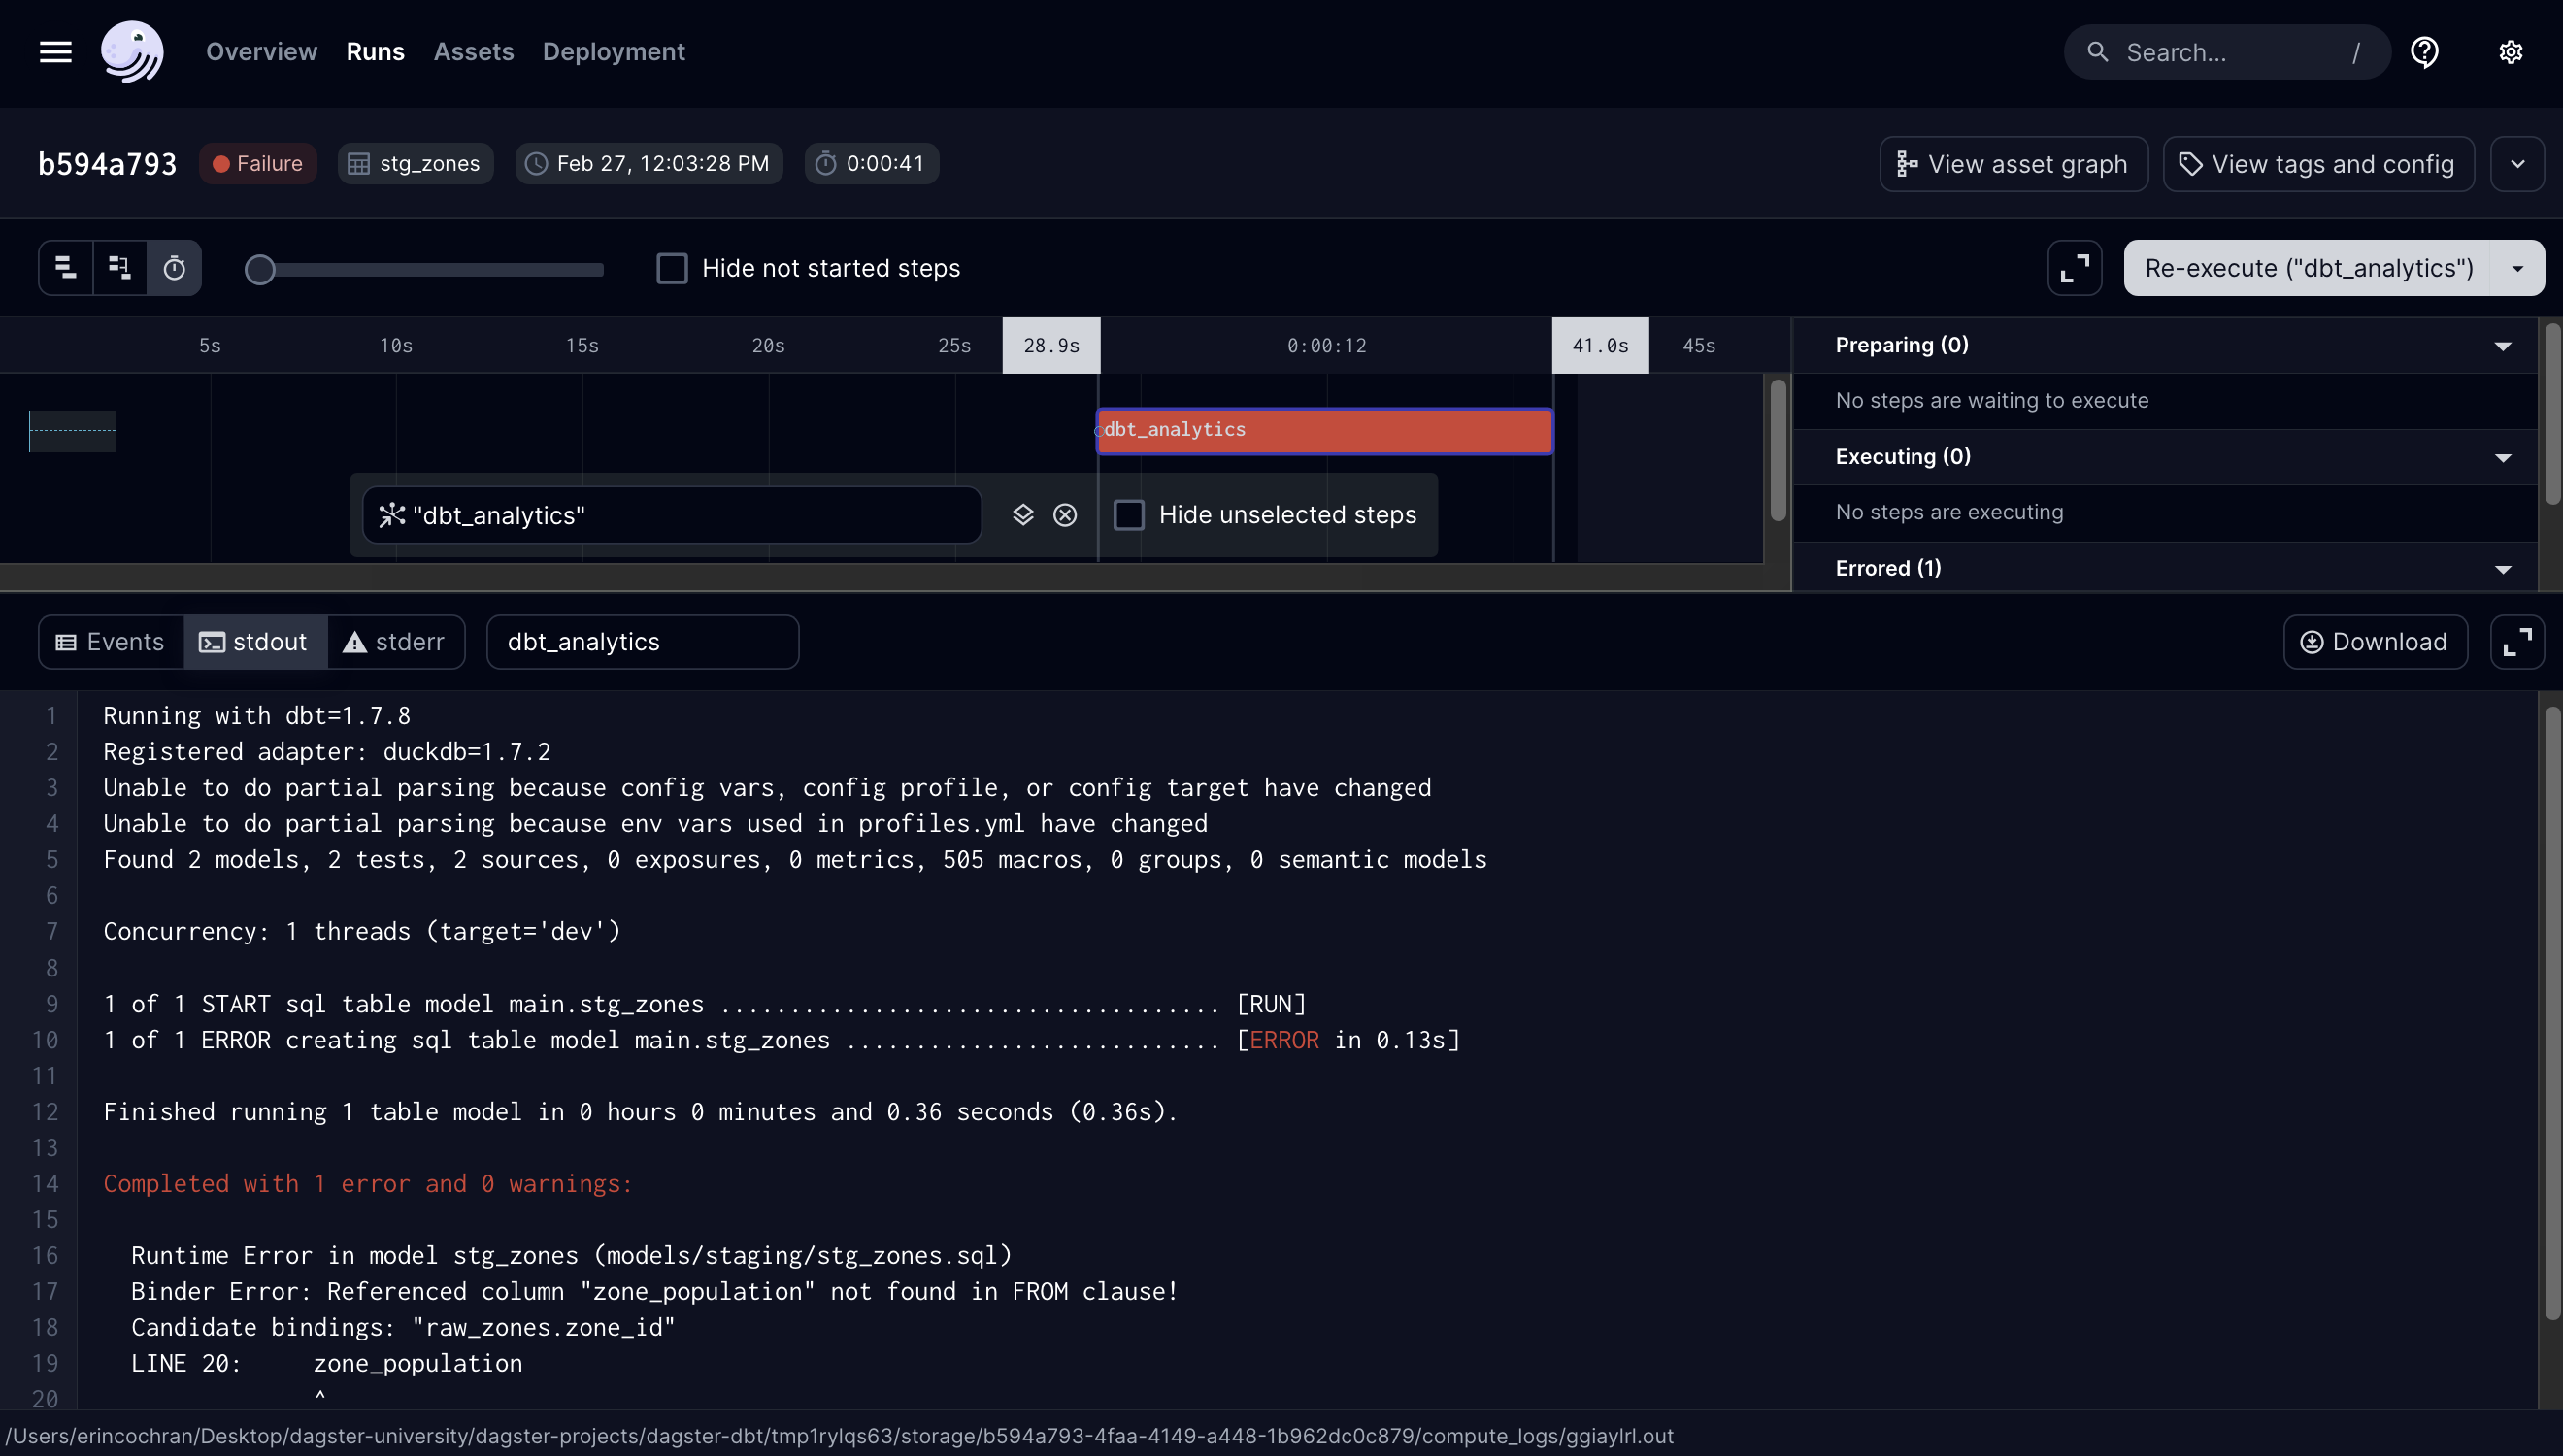
On the run’s details page, click the
dbt_analyticsstep.
In these logs, we can see that DuckDB can’t find the zone_population column in stg_zones. That’s because this column doesn’t exist!
Now that we know what the problem is, let’s fix it:
- Remove the
zone_populationcolumn from thestg_zonesmodel - In the Dagster UI, reload the code location to allow Dagster to pick up the changes.
At this point, if you materialize the stg_zones asset again, the run should be successful.